How We Helped an Auto Parts Plant Cut MES Query Times by Up to 116x
On a single automotive parts production line, PLCs write a new data point every few hundred milliseconds, with SCADA, test equipment, and vision inspection systems reporting in parallel — easily over a hundred million data points a day. Yet at one automotive parts manufacturer (referred to here as Company M), none of it could be consumed in real time. The most complex query in their Manufacturing Execution System (MES), plant-wide downtime statistics, took 46 seconds to run. Shift output statistics took nearly 6 seconds at only 50 million rows. And performance degraded non-linearly as the dataset grew, meaning the problem would only get worse every year.
The root issue wasn't the MES itself, but the data foundation underneath it. MES used to be primarily a system of record — logging output and pass/fail counts, with reports run on a schedule — and a relational database with offline analytics was good enough for that. But shop floors now expect MES to behave more like a decision-making hub: OEE, output, and downtime visible within minutes rather than after the fact; traceability down to the individual unit and process step rather than the batch; and tighter integration with ERP, WMS, QMS, and SCADA systems.
Company M's setup hadn't kept pace. Production statistics ran through heavy aggregate queries, nested SQL, and intermediate result tables — fine at modest volumes, but exposed by the structural weaknesses relational databases have at scale: expensive I/O from row-based storage, complex execution plans, and intermediate results constantly spilling to disk. None of this is fixable through SQL tuning or more hardware. And since MES systems are usually deeply embedded in production workflows after years of stable operation, ripping one out is both expensive and risky. The more realistic fix is to upgrade the data layer underneath while leaving the existing MES logic intact.
A Unified Data Foundation, Not a Replacement
This is the gap DolphinDB, a time-series database built for industrial workloads, is designed to fill — not by replacing MES, but by sitting underneath it as a unified data layer: MES manages business process, DolphinDB manages real-time data. Company M's migration was incremental by design, starting with the slowest, most painful queries and validating each one before expanding scope, which kept the risk of the transition manageable rather than turning it into a high-stakes cutover.
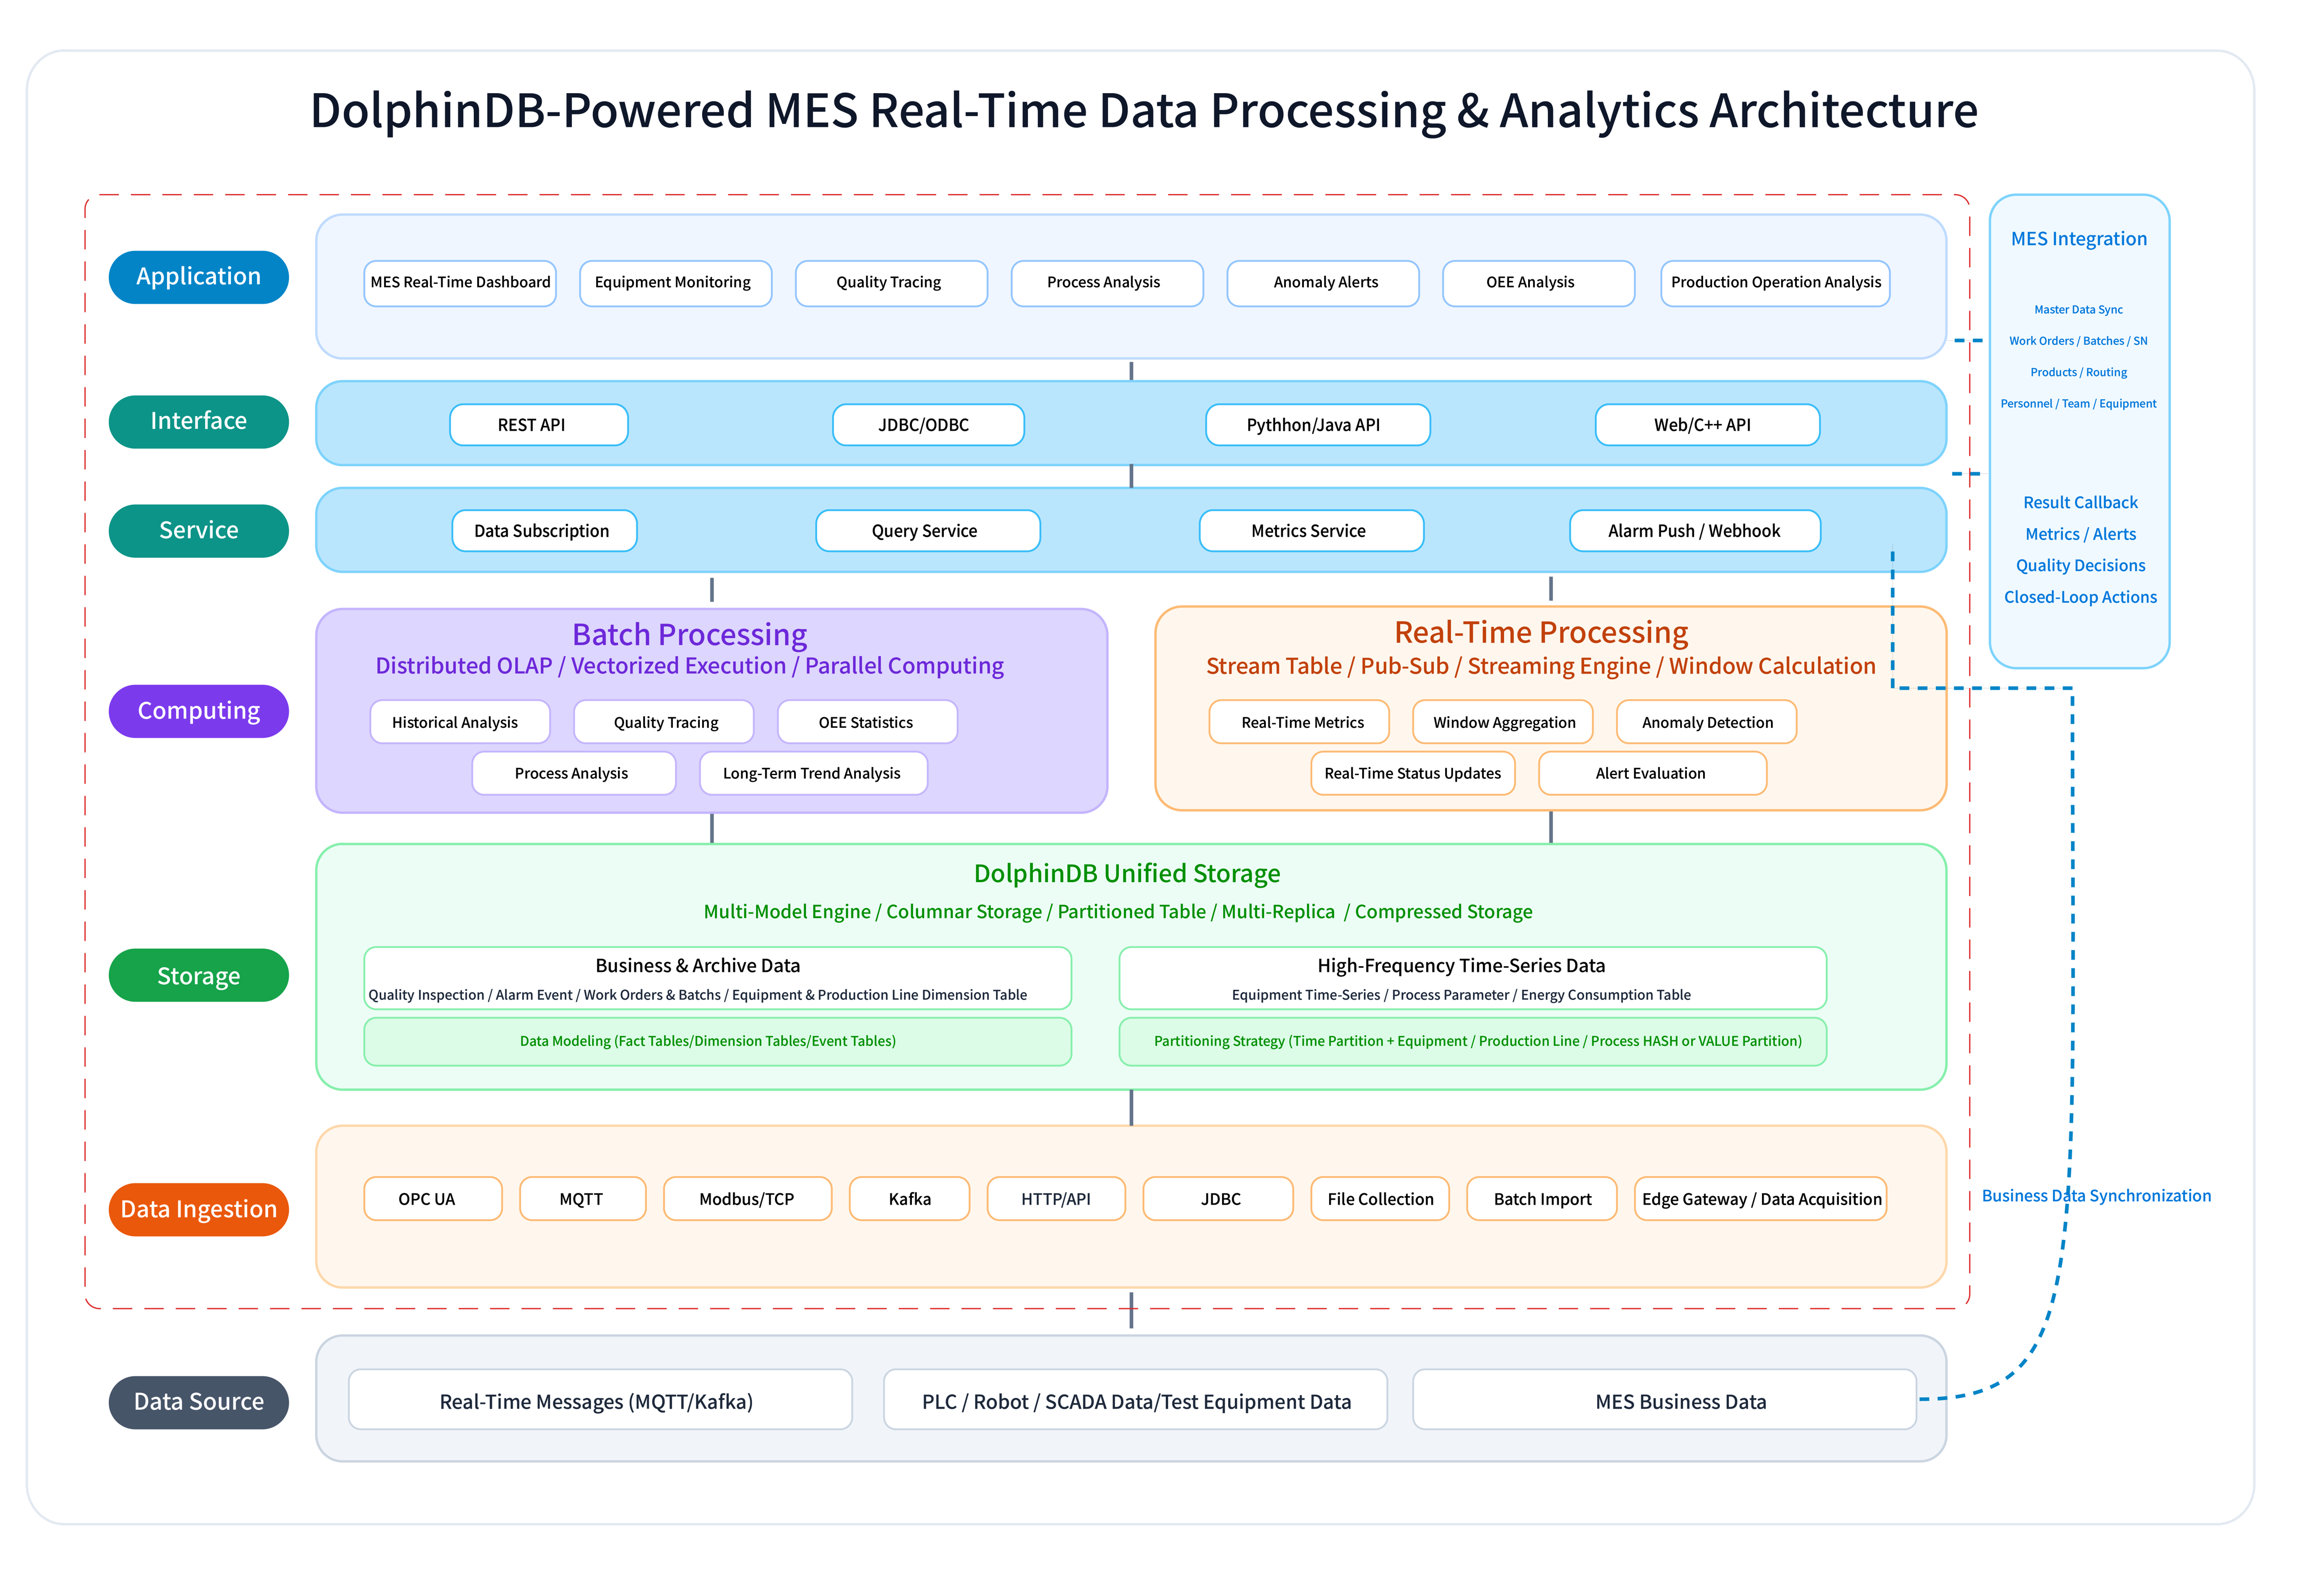
Architecturally, the approach breaks down into seven layers, with DolphinDB handling the middle five: ingestion, storage, computation, service, and interface.
On the ingestion side, shop-floor data sources vary widely in protocol — PLCs typically use OPC UA, equipment-side systems often rely on MQTT, inter-system data frequently moves over Kafka — and DolphinDB pulls these heterogeneous streams into one pipeline, handling protocol parsing, cleaning, time alignment, and outlier filtering along the way.
For storage, time-series data like equipment status and process parameters gets partitioned by time and production line, business data like work orders is managed through dimension tables, and historical data is compressed and archived efficiently, avoiding the complexity of stitching data together across separate systems.
On the computation side, built-in stream processing and distributed computing mean there's no need for a separate streaming system for real-time work or a separate OLAP engine for historical analysis — and because of stream-batch unification, real-time computation and historical analysis can share the same business logic without duplicate development.
The service and interface layers let teams package recurring logic — shift statistics, OEE calculations — into reusable services through function views, exposed to existing MES and upstream applications through standard interfaces like Python/Java APIs and JDBC/ODBC, with minimal changes required to what's already in place.
This is exactly the architecture Company M put to use, connecting PLC, SCADA, and business system data into one pipeline and moving their core statistical queries onto it. The technical mechanics behind each of DolphinDB's performance gains map directly onto specific weaknesses in the old approach.
What Changed, Query by Query
All of the following results come from testing against real production data volumes, run on an Intel Xeon Silver 4216 (16-core) server with 64GB RAM and SSD storage, on DolphinDB Server 3.00.5, with cold-cache testing throughout to reflect genuine scan and aggregation performance rather than results inflated by caching.
Shift output statistics — 63x faster.
This is one of the most frequently run queries in any MES, aggregating production records by shift to support dashboards, shift-handover reports, and daily floor operations. Under the old architecture, response times had already crept into the multi-second range at 50 million rows, with overhead climbing as historical data piled up.

DolphinDB partitions data using a composite scheme based on production date and line code, so partition pruning can locate the relevant data without scanning the full table. Columnar storage is naturally suited to aggregations like SUM and COUNT, and combined with vectorized execution, this kept response times stable in the low hundreds of milliseconds.
Hourly output statistics — up to 116x faster.
This query slices OK/NG counts by time window while joining work order, equipment, and shift data — a classic case of multi-dimensional joins layered on top of time-window aggregation, and the kind of query that punishes row-based storage particularly badly.
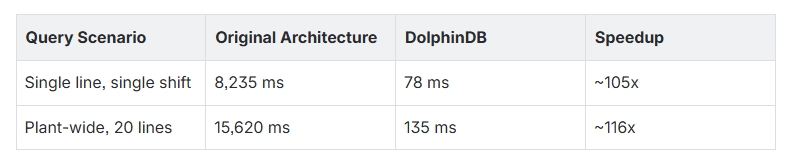
DolphinDB's TSDB time-series engine takes advantage of data being naturally ordered by time, which substantially cuts the sorting and temporary-result overhead that time-window aggregation normally requires. Because this query only touches a handful of fields, columnar storage also means only those columns get read, rather than loading full rows regardless of which fields are actually needed. Whether for a single line or the whole plant across multiple lines, response times stayed in the low hundreds of milliseconds.
Alarm and downtime statistics — 46 seconds down to milliseconds.
This was both the most complex query and the one with the most dramatic improvement. Unlike straightforward aggregation, it requires identifying alarm start/end points, calculating downtime intervals, and allocating time across shift boundaries — logic that, under the old architecture, depended on window functions, temporary tables, and multiple layers of nested SQL, producing execution plans so complex that intermediate results were constantly spilling to disk. 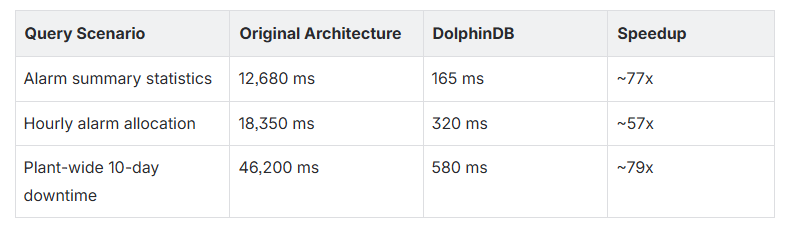
DolphinDB handles state-transition identification, interval calculation, and shift-based allocation directly based on time ordering, collapsing what used to be dozens of lines of nested SQL into a much more concise time-series expression. The gain here wasn't just speed — simplifying the query logic itself made the system meaningfully easier to maintain going forward.
To confirm these gains would hold up as Company M's data kept growing rather than degrading the way the old system did, the team held query conditions fixed and progressively scaled up the dataset, using shift output statistics as the benchmark.
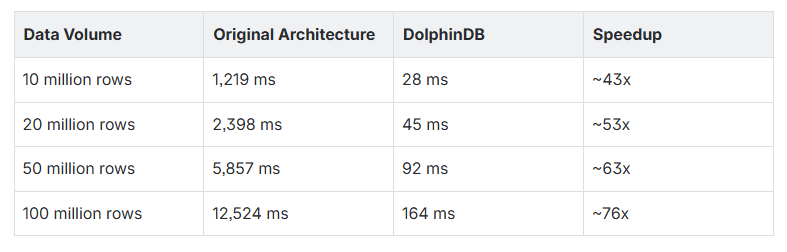
Query time under the old architecture grew non-linearly as volume increased — exactly the pattern that had been compounding the problem year over year. DolphinDB, by contrast, kept response times under 200 milliseconds even at 100 million rows, with growth that stayed close to linear, meaning performance remains predictable as the system continues to scale.
The Bigger Picture
Across all three scenarios, Company M's core MES queries went from tens of seconds down to milliseconds, with the most complex scenarios improving 57x to 116x, and performance held stable under 200 milliseconds even after scaling to 100 million rows. Just as importantly, the data pipeline that used to depend heavily on ETL jobs, intermediate tables, and offline statistical processing got substantially simpler — reducing both system complexity and ongoing maintenance overhead.
That last point matters as much as the raw speedup numbers. Turning an MES from a record-keeping system into a real-time decision-making hub isn't something a faster database alone accomplishes — it requires shifting the underlying data capability from "after the fact" to "real-time," and building a foundation that can keep evolving to support more complex analysis down the road: quality traceability, process optimization, and eventually AI-driven applications on the shop floor.
As manufacturing data volumes keep crossing the hundred-million-row mark — increasingly the norm rather than the exception — the limitations relational databases hit with high-frequency time-series aggregation are a problem more manufacturers will run into, not fewer. Company M's experience is a useful data point for how to approach it: the fix doesn't have to mean starting over. Upgrading the data layer alone, leaving the existing MES untouched, and tackling the slowest queries first, is a path that keeps both the cost of change and the risk of the transition in check — while still delivering results that are hard to dismiss.
Thanks for reading! Stay connected with DolphinDB by following us on X (@DolphinDB_Inc) and LinkedIn for the latest updates, technical articles, and product news.