How Crypto Pin Bars Form and How to Detect Them: Lessons from a $19B Liquidation
One Candlestick, $19 Billion Wiped Out Overnight
On October 10, 2025, the U.S. abruptly announced a 100% tariff on all Chinese imports and introduced new export restrictions on critical software. The news shattered an otherwise quiet Friday evening. Bitcoin plunged more than 14% from near its all-time high, while several Altcoins fell by as much as 70% before rebounding [1]. Within just a few hours between October 10 and 11, more than $19 billion in leveraged positions were liquidated, making it one of the largest single-day liquidation events in crypto market history.
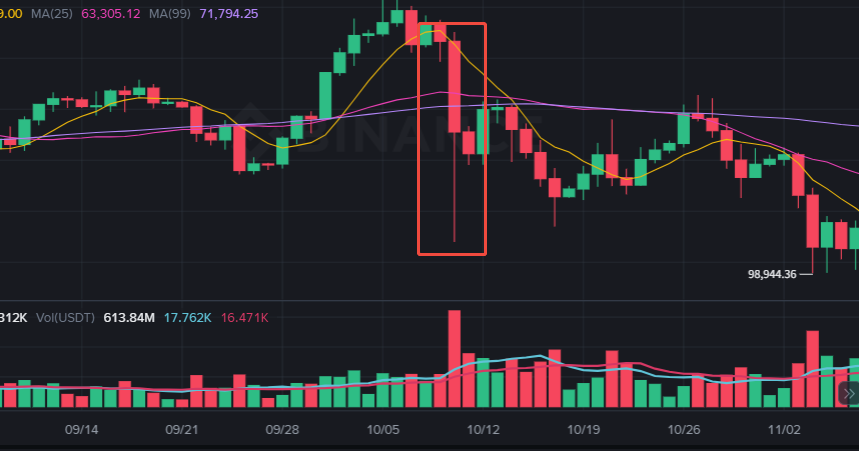
Left behind on the charts: a series of long lower wicks that traders know all too well as pin bars.
What Is a Pin Bar?
A pin bar is an extreme candlestick pattern characterized by a very long wick and a relatively small body. The price briefly breaks through a key support or resistance level before rapidly reversing, leaving behind a distinctive "needle" on the chart. It serves as the market's fingerprint of a brief loss of equilibrium.
The concept originates from classical candlestick analysis and can be traced back to Steve Nison's pioneering work on candlestick techniques [2]. Traditional definitions, however, are largely qualitative. To provide a more objective definition, we quantify a pin bar using the following criteria:
- The wick is significantly longer than the candlestick body.
- The wick accounts for a large proportion of the candlestick's total price range.
- The overall price range exceeds a minimum absolute or relative threshold to filter out normal bid-ask fluctuations.
Why Do Pin Bars Occur?
Market microstructure offers several classic explanations.
1. Informed Trading
Large institutions or traders with superior information execute sizable orders during periods of limited liquidity, causing significant price impact.
2. Insufficient Liquidity
Smaller cryptocurrencies often have shallow order books, allowing a single large order to move the market by several percentage points.
3. Market Manipulation
Some traders intentionally trigger clusters of stop-loss or liquidation orders by forcing prices through key levels before buying back at lower prices.
4. Leverage and Cascading Liquidations
This is the most common and most destructive mechanism. Highly leveraged long positions tend to concentrate their liquidation levels just below important support prices. Once the market reaches those levels, systems automatically execute market sell orders. The additional selling pressure pushes prices even lower, triggering more liquidations and creating a vicious cycle:
Pin Bar → Liquidations → Deeper Pin Bar
The October 10 crash provides a textbook example of this mechanism. Bitcoin was trading near its historical highs, with the market heavily positioned on the long side using excessive leverage. Meanwhile, liquidity had thinned during Friday evening as institutional market makers reduced activity. Under such conditions, a single geopolitical shock was enough to ignite the cascade.
Reconstructing October 10: What the Data Saw
This analysis is based on real market data collected from Binance and OKX throughout October 2025. Three types of datasets are used:
- Minute-level candlestick (K-line) data for identifying pin bar patterns.
- Aggregated trade data for calculating VPIN (Volume-Synchronized Probability of Informed Trading).
- Order book depth snapshots for measuring order book imbalance.
All timestamps are converted to UTC and stored in the DolphinDB distributed database for analysis.
We begin by reconstructing the event using the three most direct indicators—pin bar patterns, liquidation records, and trading volume—to understand exactly what unfolded on that day.
Identifying Pin Bars
We scanned the 5-minute BTCUSDT candlestick data from Binance to identify pin bars using the following criteria:
- Wick length > 5 × body length
- Wick length > 50% of the total candlestick range
- Candlestick range > 0.5% of the average price
The core implementation is shown below:
update dataKline set body = abs(close - open)
update dataKline set amplitude  = (high - low)
update dataKline set upper = (high - max(open,close))
update dataKline set lower = (min(open,close) - low)
update dataKline set avgPrice = (open + close)/2
//Detection criteria (adjust as needed)
a,b,c = 5.0,0.5,0.5
pinbar = select * from dataKline where lower > body * a and lower > amplitude * b
pinbar_upper = select * from dataKline where upper > body * a and upper > amplitude * b
pinbar.append!(pinbar_upper)
pinbar = select * from pinbar where amplitude > avgPrice*c*0.01 order by eventTime
Using the 5-minute BTCUSDT candlestick data from Binance as an example, the detection results are shown below:

Candlesticks identified as pin bars are typically accompanied by unusually high trading volume compared with the day's average. As shown in the figure, at 2025-10-10 21:20:00 UTC, the price briefly fell to 101,516 USDT, dropping by more than 7,000 USDT from the opening price of 108,888 USDT. It then rebounded rapidly and closed at 107,747 USDT. Trading volume during this interval was approximately an order of magnitude higher than during other periods of the day.
So, who was selling during this period, and how much was actually sold?
Liquidation Data: Reconstructing the Cascade of Forced Liquidations
To answer this question, we aggregated minute-level liquidation data from Binance and OKX for the entire month of October. The data were then summarized by liquidation direction (long vs. short) to reveal the overall liquidation dynamics.
liqDataForSym = select * from loadTable("dfs://CryptocurrencyDay","liquidation")
update liqDataForSym set eventTime = temporalAdd(eventTime, -8, "H")  //Convert to UTC
liqDataForSymDay = select sum(quantity),side, date,symbolSource from liqDataForSym
    group by symbolSource,side, date(eventTime) as date
res1 = select * from liqDataForSymDay order by date
liqDataForOneDay = select sum(quantity), side,eventTime,symbolSource from liqDataForSym
    where date(eventTime) = 2025.10.10 group by symbolSource,side, bar(eventTime,1m) as eventTime
res2 =select * from liqDataForOneDay order by sum_quantity desc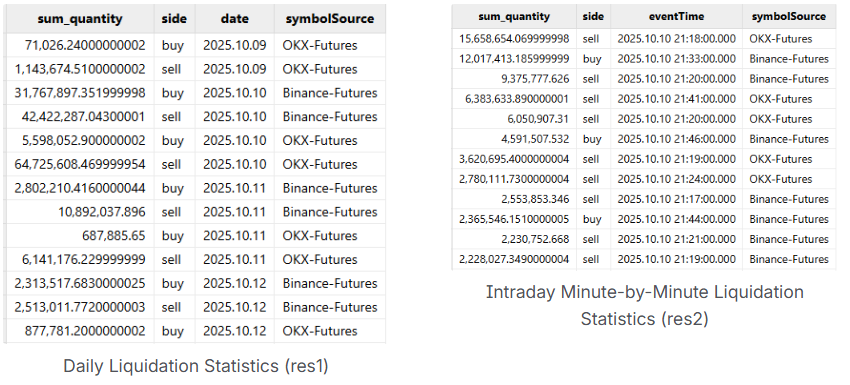
The results are striking. The total liquidation volume on October 10 far exceeded that of any other day in the month. In terms of liquidation direction, long liquidations (forced sell orders) overwhelmingly outnumbered short liquidations, providing strong evidence of a cascading long squeeze. Intraday, liquidation activity peaked between 21:10 and 22:00, closely matching the period in which pin bars were most frequently detected.
Using XRPUSDT as an example, the figure below illustrates the relationship between minute-level liquidation volume and price movements.

XRPUSDT tradeQty vs Volatility
The results show that trading volume surged sharply after 20:50, indicating that the shift in market sentiment occurred before the largest price decline. A wave of aggressive sell orders entered the market first, disrupting the supply-demand balance. These active sell orders were then amplified by forced liquidation orders, together driving larger price swings and ultimately producing the sharp wick observed around 21:20.
The Signals That Were Already There
The previous analysis reconstructed the full sequence of events during the price wick. For traders, however, stop-loss orders being triggered, positions being liquidated, or even accounts being wiped out often happen within minutes—or even seconds. Post-event analysis offers little practical value. The more important question is whether these events can be anticipated before the wick forms.
To answer this, we evaluated two market microstructure indicators—VPIN and Order Book Imbalance—using historical data to determine whether the market had already begun signaling elevated risk before the extreme price movement occurred.
VPIN: Tracking the Evolution of Order Flow Toxicity
VPIN (Volume-Synchronized Probability of Informed Trading) was introduced by Easley et al. in 2011 [3]. Its key idea is to measure market activity based on trading volume rather than clock time. Specifically, the order flow is divided into equal-volume buckets, and the imbalance between aggressive buy orders and aggressive sell orders is calculated for each bucket. A larger imbalance indicates that one side is dominating the market, implying higher order flow toxicity and a greater likelihood of extreme price movements.

We calculated the VPIN indicator using aggregated trade data to track the dynamics of order flow toxicity across multiple cryptocurrencies throughout October.
Parameter settings: The fixed bucket size (V) was determined by dividing the average daily trading volume over the previous 20 trading days by 50 buckets per day. A rolling window of 10 buckets was used to calculate VPIN. The indicator was computed in parallel for BTC, ETH, XRP, and ADA.
symList = [`BTCUSDT,`ETHUSDT,`XRPUSDT,`ADAUSDT]
targetSource = "Binance-Futures"
dataType = "trade"  //"trade" or "minKLine"
d,N,n = 20,50,10  //Use the first d days, divide each day into N buckets to calculate V, with a window size of n
//Parallel computation across multiple trading days
Date = 2025.10.01..2025.10.30   //UTC time
result = peach(calcVPINForAllSym{,symList,targetSource,dataType,d, N,n}, Date)
res = select * from unionAll(result) order by symbol, eventTime
// Calculate volatility and correlation simultaneously
result = calcVPINVolCor(res)
The figure below compares VPIN with price volatility.
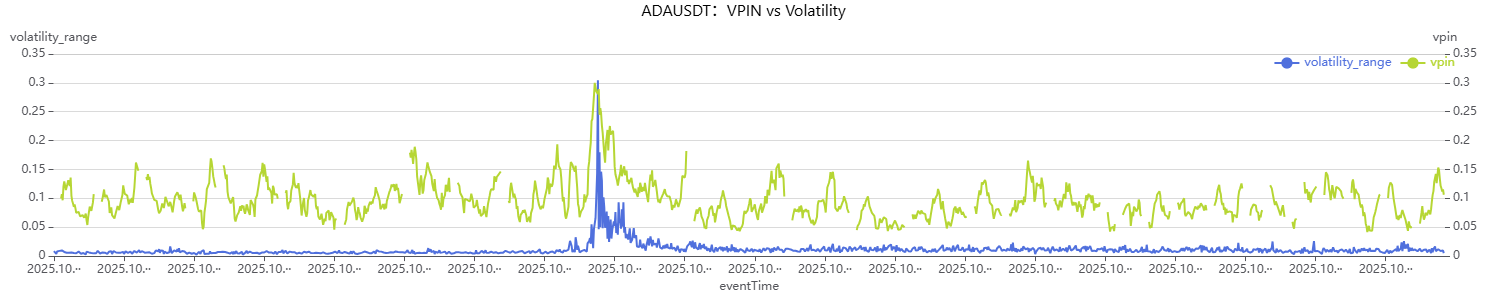


From the result we can see:
- ADA and ETH: VPIN and price volatility were highly synchronized around October 10. In many cases, sharp increases in VPIN either preceded or coincided with significant price swings, suggesting that VPIN exhibits meaningful early warning characteristics.
- BTC: The relationship between VPIN and price volatility was noticeably weaker, which is consistent with Bitcoin's larger market size and stronger liquidity absorption capacity.
- Cross-asset pattern: The lower the liquidity of an asset, the more sensitive VPIN is as an early warning indicator for extreme market events.
The imbalance in order flow is already evident—but what about order book liquidity? Was market depth deteriorating at the same time?
Order Book Imbalance: Detecting the Early Signs of Liquidity Exhaustion
Another indicator that directly reflects market conditions is the Order Book Depth Ratio. It is calculated as the ratio of the cumulative bid size from Level 1 to Level N to the cumulative ask size from Level 1 to Level N.

When this ratio drops sharply, it indicates that buy-side liquidity is rapidly disappearing. Under such conditions, even modest selling pressure can trigger a cascade of price declines [4].
To validate this hypothesis, we analyzed order book depth snapshots from October 10, 2025. To avoid signal dilution caused by averaging multiple snapshots, we retained only the last snapshot of each minute. We then calculated a normalized order book imbalance metric and compared it with subsequent price volatility.
The analysis consisted of the following steps:
- Retrieve order book depth data and calculate the imbalance metric.
- Retain the last order book snapshot of each minute to preserve signal strength.
- Calculate future returns and price volatility over different forward-looking windows.
- Identify depth imbalance spikes using the 90th percentile of depthRatioQtyDiff for each asset as the threshold.
- Compute ampRatio = future volatility following a Spike / future volatility without a Spike to evaluate the predictive power of the indicator.
use CalcDepthRatioModule
symList = [`BTCUSDT,`XRPUSDT,`ETHUSDT,`ADAUSDT]
targetSource = "Binance-Futures"
targetDate = 2025.10.10  //supports date range input
futureStep = 5  //number of future bars for amplitude window
// Call main function depthRatioAnalysis to execute
Data, spikeComparisonForSym, corrForSym = depthRatioAnalysis(symList,targetSource,targetDate,futureStep)
Using ADAUSDT as an example, the figure below compares the order book imbalance indicator with price movement.

When the order book imbalance exceeded the 90th percentile, creating an extreme spike, the average price range over the following five minutes increased significantly across all assets. This suggests that severe order book imbalances are indeed associated with elevated short-term volatility and can serve as an effective early warning signal for flash wicks.
The order book data used in this case includes the top 20 price levels from Binance and the top 5 price levels from OKX. Since this does not represent the exchanges' complete order books, we also used the difference between the best bid and best ask quantities (bidQty[0] - askQty[0]) as a real-time proxy for market liquidity:
//...
data = select * from loadTable("dfs://CryptocurrencyTick","depth")
    where symbol = "BTCUSDT" and symbolSource = sySource and eventTime between startTargetTime:endTargetTime
update data set eventTime = temporalAdd(eventTime, -8, "H") //Convert to UTC
plotData = select eventTime,symbolSource,symbol,(bidQty[0]-askQty[0]) as diffQty from data
// Difference between cumulative bid and ask quantities across multiple order book levels
// plotData = select eventTime,symbolSource,symbol,each(sum,bidQty-askQty) as diffQty from data
plot(plotData[`diffQty],plotData.eventTime.minute(),"bid-ask spread",extras={multiYAxes: true})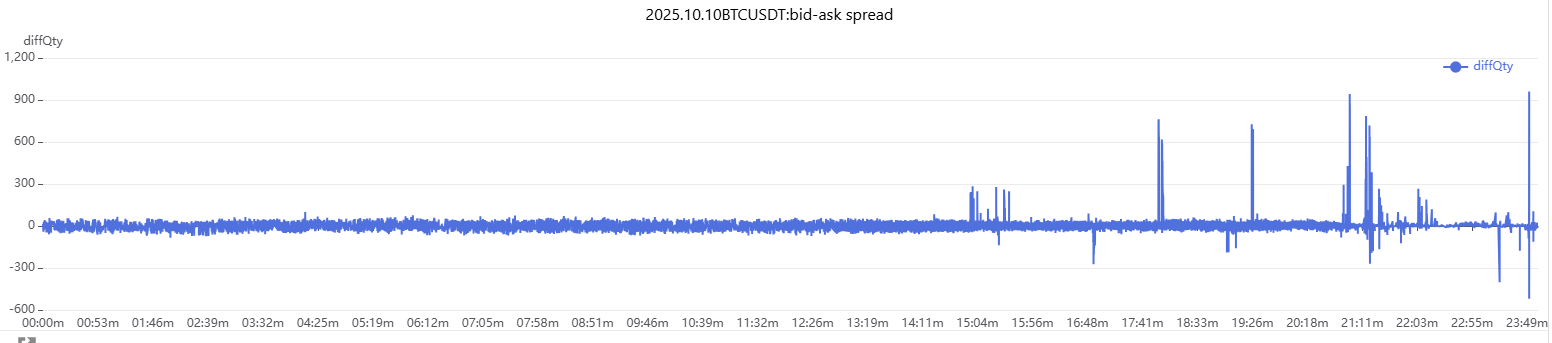
As shown in the figure above, the order book exhibited several episodes of significant imbalance throughout the day, with the most pronounced fluctuations occurring between 21:00 and 22:10. This period coincided with the sharpest price movements, indicating severe order flow imbalance and a substantially higher likelihood of flash wick events.
Building a Real-Time Risk Monitoring System with VPIN
Identifying the signal is only the first step. During extreme market conditions, traders cannot afford to wait until offline analysis is complete before taking action. To address this, we integrated these indicators into a real-time stream processing pipeline and built a VPIN-based monitoring system that automatically generates alerts whenever abnormal conditions are detected, helping traders reduce exposure or exit positions before market conditions deteriorate further.
The workflow consists of four steps:
1. Continuously ingest aggregated trade data and divide the order flow into equal-volume buckets (bucket size = average daily trading volume over the previous 20 trading days ÷ 50 buckets per day).
2. Calculate the buy-sell imbalance (diffQty) for each bucket in real time.
3. Compute VPIN using a rolling window of 5 buckets. Trigger an alert whenever VPIN exceeds a predefined threshold (e.g., 0.2).
4. Push real-time notifications through channels such as WeCom or email to assist traders in making timely decisions.
We replayed historical market data from October 10, 2025 to simulate the real-time monitoring process. Using ADAUSDT as an example:
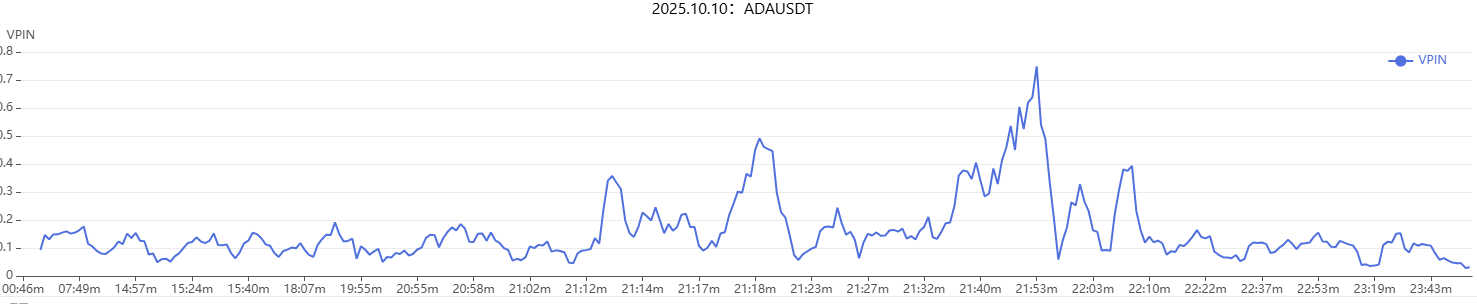
The results show that VPIN for ADAUSDT rose sharply after 21:00, closely matching the period of extreme price volatility. This demonstrates that the proposed monitoring framework is capable of providing meaningful early warning signals before flash wick events unfold.
Conclusion
Pin bars are not random market noise. From surging trading volume and rising VPIN to the depletion of order book liquidity, every stage leaves measurable traces in the data. The real danger is not the wick itself, but the liquidity vacuum and leveraged pressure that quietly accumulate beforehand—and those warning signs are already embedded in the market data long before the event occurs.
All analyses in this article were implemented using DolphinDB. From batch historical replay across multiple exchanges to real-time stream processing of VPIN and order book imbalance with automated alerts, the entire workflow runs within a unified framework. The goal is simple: surface critical signals when they matter—not after the market has already moved.
Reference
[1] Jung Hua Liu.(2025). Crypto “Black Swan” Crash: An Academic Analysis: The October 11, 2025 Crypto “Black Swan” Crash: An Academic Analysis | by Jung-Hua Liu | Medium.
[2] Nison, S. (1991). Japanese Candlestick Charting Techniques. New York: New York Institute of Finance.
[3] Torben G. Andersen,Oleg Bondarenko (2014). VPIN and the Flash Crash: Journal of Financial Markets
[4] How to Read and Interpret Liquidity and Order Book Depth: How to Read and Interpret Liquidity and Order Book Depth.
Thanks for reading! Stay connected with DolphinDB by following us on X (@DolphinDB_Inc) and LinkedIn for the latest updates, technical articles, and product news.