Putting TabPFN to Work: How Well Can It Rank Stocks?
Predicting a stock's exact return is a losing game — the signal-to-noise ratio in minute-level financial data is simply too low. But predicting which stocks will outperform their peers is a different problem, and a much more solvable one.
That's the premise behind this workflow: instead of chasing precise regression accuracy, we use TabPFN to generate fast, reliable ranking signals from noisy factor data, and turn them into a working stock-selection strategy.
What Is TabPFN
TabPFN (Tabular Prior-data Fitted Network) is a foundation model designed for small- to medium-sized tabular datasets. Instead of training a model from scratch, it uses in-context learning to produce strong baselines in minutes — and when the task diverges significantly from its pre-training distribution, it can also be fine-tuned for better adaptation.
This makes it a natural fit for stock factor prediction. Each sample — a stock's factor values at a given point in time — is exactly the kind of structured, tabular input TabPFN was designed for, while its ability to work with limited, noisy data matches the reality of minute-level financial signals. That combination makes it an efficient tool for testing whether a set of factors actually carries stock-selection value, before investing in heavier modeling.
A DolphinDB × TabPFN Workflow for Minute-Level Stock Selection
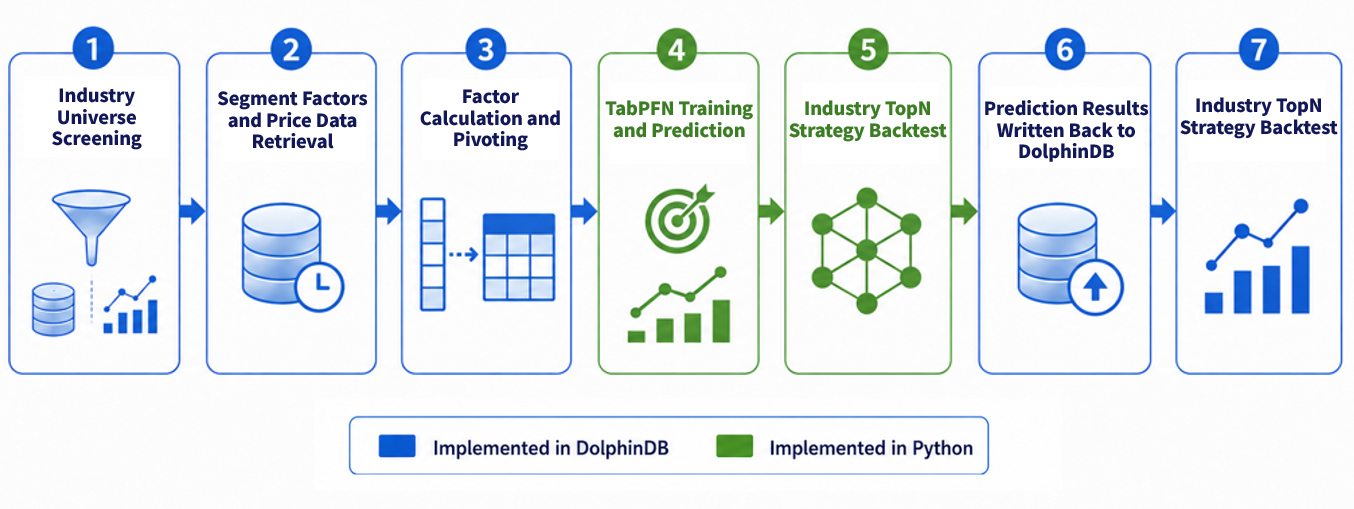
We use minute-level stock factor data to predict 30-minute forward returns. DolphinDB handles stock universe selection, factor pivoting, price and factor alignment, and backtesting, while Python and TabPFN handle data preprocessing, model training, and prediction.Together, they turn raw factor data into an industry-level Top-N stock selection strategy.
Here's what that pipeline looks like end to end:
Case Study
This case study uses the Shenwan Level-2 Steel industry (801044.SI), which has 23 constituent stocks. The goal is to predict 30-minute forward returns from minute-level factors and build a cross-sectional Top-N stock selection strategy.
Data Preparation: Stock Universe, Factors, and Prices
We first load the industry constituents, minute-level factors, and closing prices into DolphinDB.
The examples below use the DolphinDB Python API, which must be installed before running the code.
First, we retrieve the stock universe for the target industry. The query is wrapped in a function and can be adapted to your table schema:
def fetch_code_list_from_ddb(session):
    script = f"""
        exec code
        from {INDUSTRY_TABLE}
        where l2_code == "{INDUSTRY_CODE}"
    """
    code_df = session.run(script)
    return code_df.tolist()
Next, we retrieve the corresponding minute-level factor data and price data for the selected stocks, then join them to create the model input dataset.
script = f"""
    // Query factor data
    factor = select factorvalue
    from {FACTOR_TABLE}
    where code in {code_filter}
      and trade_date >= {start_time.strftime('%Y.%m.%d')}
      and trade_date < {end_time.strftime('%Y.%m.%d')}
      and trade_time >= 09:30:00
      and trade_time <= 15:00:00
    pivot by code, trade_date, trade_time, factorname
    // Query price data
    price = select code, trade_date, trade_time, close
            from {PRICE_TABLE}
            where code in {code_filter}
              and trade_date >= {start_time.strftime('%Y.%m.%d')}
              and trade_date < {end_time.strftime('%Y.%m.%d')}
              and trade_time >= 09:30:00
              and trade_time <= 15:00:00
    // Join price and factor tables
    lj(price, factor, `code`trade_date`trade_time)
"""
chunk_df = session.run(script)
The minute-level factor table typically uses a long format, where each row contains a stock, timestamp, factor name, and factor value.
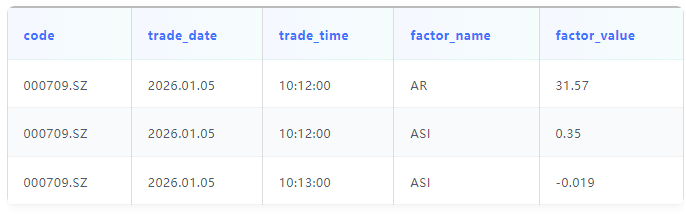
This format makes it easy to add or update factors without changing the schema.
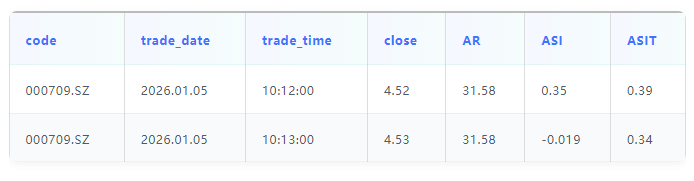
Since machine learning models expect one sample per row and one feature per column, we use DolphinDB’s pivot by to convert the long-format data into a wide format, with each row representing a stock’s factor vector at a given time.
The result combines minute-level factors, the stock universe, and price data into a model-ready dataset:
Label Definition: 30-Minute Forward Return
The target is the 30-minute forward return:
return_30min = close(t + 30min) / close(t) - 1Here, close(t) is the current closing price and close(t + 30min) is the price 30 minutes later. To avoid overnight effects, we keep only samples up to 14:30.
The 30-minute horizon matches the rebalancing interval used in backtesting.
Factor Selection and Preprocessing
We start with 335 factors from DolphinDB's built-in MyTT, WorldQuant 101 Alpha, and GTJA 191 Alpha factor libraries.
To reduce noise and redundancy, we apply three filters:
- Remove factors with a training-set missing rate above 30%.
- Retain factors with stronger and more stable RankIC/ICIR.
- For factor pairs with an absolute correlation above 0.9, keep the one with the higher RankIC.
This reduces the factor set from 335 to 45, providing a cleaner feature set for modeling.
Baseline Prediction
We first use TabPFNRegressor without fine-tuning as a baseline:
model = TabPFNRegressor()
model.fit(X_train, y_train)
pred = model.predict(X_test)
This provides a quick benchmark for TabPFN's predictive and ranking performance before fine-tuning.
Note: Each predict() call recomputes the training context. When possible, predict the test set in a single call. If GPU memory is limited, use a few larger batches instead of many small ones.
Fine-Tuning
We then fine-tune the pre-trained model with FinetunedTabPFNRegressor to better adapt it to the target industry's factor and return distributions.
model = FinetunedTabPFNRegressor(
    device=DEVICE,
    epochs=EPOCHS,
    learning_rate=LEARNING_RATE,
    n_finetune_ctx_plus_query_samples=N_FINETUNE_CTX_PLUS_QUERY_SAMPLES,
)
model.fit(
    X_train,
    y_train,
    output_dir=OUTPUT_DIR,
)
Key parameters include the learning rate, epochs, early stopping, samples per step, and prediction ensembles.
N_FINETUNE_CTX_PLUS_QUERY_SAMPLES controls the total context and query samples per training step. Reduce it if GPU memory is limited. We set it to 5,000 in our experiments.
After fine-tuning, the trained weights can be loaded into TabPFNRegressor via model_path for inference.
Evaluation Metrics: Why RankIC Matters
For stock return prediction, MSE and R² do not fully reflect model performance. In stock selection, the key question is not how accurately returns are predicted, but whether the model can rank better-performing stocks higher. Therefore, we use RankIC as the primary metric.
RankIC is the Spearman rank correlation between predicted scores and realized returns, measuring cross-sectional ranking ability. We also report Mean RankIC, RankIC Std, and ICIR:
- Mean RankIC: Overall ranking ability
- RankIC Std: Signal volatility
- ICIR: Ranking consistency over time
These metrics are more relevant to stock selection because the strategy relies on cross-sectional ranking rather than precise return forecasts.
Experimental Results and Backtesting
Prediction Performance
We compare the baseline and fine-tuned TabPFN models:
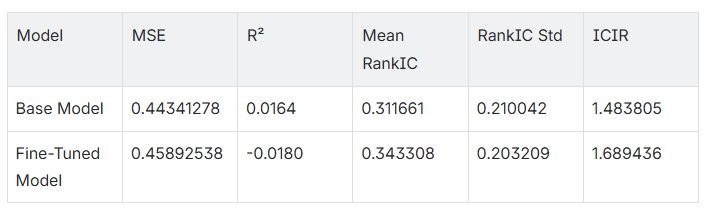
Fine-tuning slightly worsens MSE and R², but improves RankIC and ICIR, indicating stronger and more stable cross-sectional ranking performance.
For stock selection, ranking quality matters more than precise return prediction. In other words, the model does not need to predict the exact return—it needs to identify relatively stronger stocks.
Backtesting Design
We then use the DolphinDB Backtest plugin to evaluate the predictions in an industry-level Top-N strategy.
The strategy rebalances every 30 minutes, selects the top 3 stocks by predicted return, and equally weights them for the next 30 minutes. An equal-weighted industry portfolio serves as the benchmark.
The core trading logic is:
// 1. Initialize strategy parameters
def initialize(mutable context){
    context["rebalanceN"] = 3          // Hold the top 3 stocks
    context["buyThreshold"] = 0        // Minimum predicted return threshold
}
// 2. Execute on each market update
def onBar(mutable context, msg, indicator){
    // Skip if no prediction signal is available
    // Rank stocks by predicted return
    // Sell positions that fall outside the Top-N list
    // Buy Top-N stocks with equal portfolio weights
}
// 3. Register callbacks and run the backtest
callbacks = dict(STRING, ANY)
callbacks["initialize"] = initialize
callbacks["onBar"] = onBar
callbacks["finalize"] = finalize
engine = Backtest::createBacktester(engineName, config, callbacks)
Backtest::appendQuotationMsg(engine, data)
This article focuses on the research workflow and backtesting methodology. The backtest includes commissions and stamp duty, but not slippage, T+1 restrictions, or market impact. Actual trading results may therefore differ from the backtest.
Backtesting Results
The backtesting results are shown below:
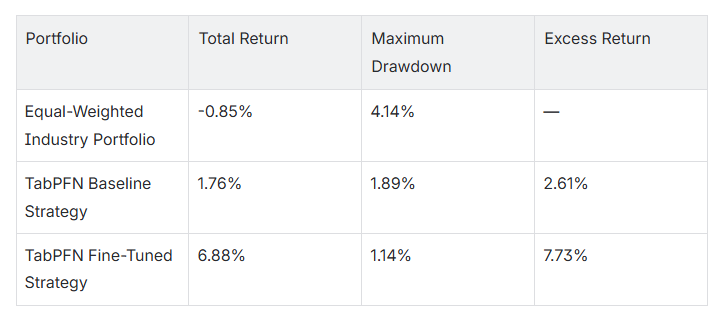
The results are clear: the baseline TabPFN model already outperformed the equal-weighted industry benchmark, while fine-tuning delivered higher returns and lower maximum drawdown. Excess return increased from 2.61% with the baseline to 7.73% after fine-tuning.
This shows that TabPFN can capture useful cross-sectional signals in 30-minute forward returns and translate them into actionable stock selection performance.
Why This Workflow Matters
The value of this workflow goes beyond return prediction. It connects minute-level factor engineering, tabular modeling, and strategy backtesting into a unified quantitative research pipeline.
TabPFN provides a fast, low-tuning baseline for testing noisy factor signals, while DolphinDB handles data preparation, factor pivoting, prediction storage, and backtesting in one system. The results show improvements not only in RankIC, but also in Top-N strategy performance, demonstrating that the model's signals can be translated into actionable stock selection.
Conclusion
If your research focuses on minute-level factors, sector rotation, or cross-sectional stock selection, the combination of DolphinDB, TabPFN, and the DolphinDB Backtest plugin provides a practical end-to-end solution.
Use TabPFN to quickly determine whether your factor signals contain predictive value. Use DolphinDB to efficiently prepare data, manage factor transformations, and validate trading strategies through integrated backtesting. Together, they form a streamlined workflow that takes predictive modeling from research all the way to strategy validation.
Feel free to reach out to us at info@dolphindb.com for more information