Orca: Making Real-Time Pipelines Easier to Build with Stream Graphs
Real-time market data processing and quantitative trading systems rarely consist of a single computation. A typical pipeline may ingest raw market data, clean and aggregate it, generate candlesticks, calculate indicators and factors, and finally feed the results into risk controls, dashboards, or trading strategies.
As these steps grow, so does the complexity of connecting them. Logic gets scattered across scripts, dependencies become harder to follow, and even a small change can mean rewiring multiple components.
A simpler way is to think of the entire pipeline as a graph.
Instead of describing each processing step independently, a graph makes the flow explicit: where data comes from, how it is transformed, how different streams are joined, and where the results go. The same representation can then serve as the blueprint for execution.
This is the idea behind ORCA, DolphinDB's real-time computing engine. ORCA lets developers compose streaming components into a single stream graph, then handles the orchestration, scheduling, and fault tolerance needed to turn that graph into a continuously running pipeline.
 Business logic
 ORCA computation pipeline
Start by Defining a Stream Graph
To understand how ORCA builds real-time pipelines, start with its core abstraction: the stream graph.
A streaming graph describes the complete path of a real-time task — input, processing, output — rather than a single computation function. If you've worked with Flink or Beam, this will feel familiar: it's the logical dataflow graph you submit, before the system decides how to schedule and execute it. It unifies streaming tables, engines, subscriptions, and outputs, which would otherwise be scattered across a script, into one coherent abstraction.
Developers just describe where the data comes from, what it goes through, and where it ends up. ORCA takes that logical graph and handles deployment, scheduling, and execution.
Take a common K-line scenario: tick-by-tick trade data is aggregated into 1-minute OHLC bars (open, high, low, close, volume), then processed further with sliding-window indicators — say, the 5-minute rolling max price and average volume.
Here's that pipeline expressed with ORCA's chained scripting syntax:
// Create a streaming graph named graph1
g = createStreamGraph(`graph1)

// source defines the input table `trade`
// intermediate engines: timeSeriesEngine and reactiveStateEngine
// sink specifies the output table `output`
g.source("trade", `symbol`datetime`price`volume, [SYMBOL, TIMESTAMP, DOUBLE, INT])
  .timeSeriesEngine(
       60*1000, 60*1000,
       <[first(price), max(price), min(price), last(price), sum(volume)]>,
       "datetime", false, "symbol")
  .reactiveStateEngine(
       <[datetime, first_price, max_price, min_price, last_price, sum_volume,
         mmax(max_price, 5), mavg(sum_volume, 5)]>,
       `symbol)
  .sink("output")
// Submit the graph to the system
g.submit()
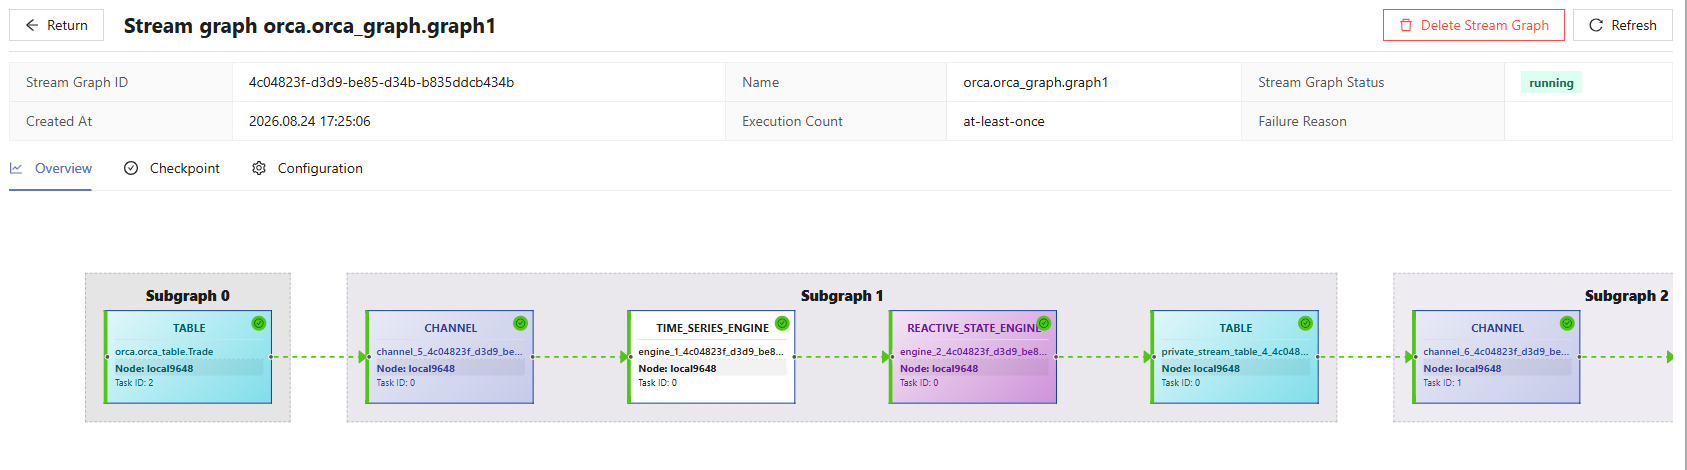
Data enters through trade, gets aggregated into OHLC bars by the time-series engine, flows into the state engine for sliding-window indicator computation, and is finally written to output. The developer only needs to define this graph and submit it — the system takes over execution and lifecycle management from there.
Note: ORCA ships with built-in streaming engines for common patterns — time-series aggregation, stateful computation, cross-sectional analysis, stream joins, and more. If none fit your case, plug in a user-defined function. For a deeper walkthrough, see the official docs.
Once submitted, the graph shows up visually in the Stream Graph panel of the Web Manager — the connections between nodes are laid out clearly. Developers can see the full path from input to output at a glance, and drill into each node's runtime status, upstream/downstream dependencies, and task configuration.
Built to Run Reliably: Production-Grade Guarantees
For a real-time pipeline like this, getting it to run is just step one. What matters more: Can you diagnose it when performance falls short? Pinpoint an error in a specific stage? Recover from a node failure without losing data or double-computing?
ORCA addresses all of this starting the moment a graph is submitted:
Task Decomposition Exposes Bottlenecks
ORCA breaks the chained logic you submit into a full stream graph, then transforms it into a job graph — splitting it into subgraphs and physical tasks. Complex pipelines that would otherwise be buried in a script get unfolded into an explicit structure — serial dependencies, cross-task data transfer, likely bottlenecks all become visible at a glance, making performance issues far easier to diagnose than reading through a script.
Resource-Aware Scheduling Prevents Hotspots
Rather than grabbing the nearest free node, ORCA weighs table location, compute groups, shared state, and node load together to place each task optimally. This cuts unnecessary cross-node overhead, avoids hot nodes, and reduces the performance volatility that plagues production systems.
Checkpointing Enables Lossless Recovery
A checkpoint-and-barrier mechanism aligns progress across the graph to a consistent recovery point. If a node or task fails, ORCA restores state from the last successful checkpoint — recovery isn't just "start over," it's closer to a no-data-loss, no-duplicate-computation restart.
End-to-End Traceability Speeds Root-Cause Analysis
Graphs, subgraphs, tasks, nodes, subscriptions, and engines are all managed under one unified view, so issues can be traced layer by layer along the dependency chain. Lifecycle operations — submit, start, stop, destroy — follow a strict order, avoiding the half-started or half-torn-down states that cause hard-to-diagnose problems.
A More Complex Case: Multi-Source Pipelines in Live Trading
Real quant workflows are usually more involved: multiple data sources, alignment and merging in the middle, followed by model inference and trade execution.
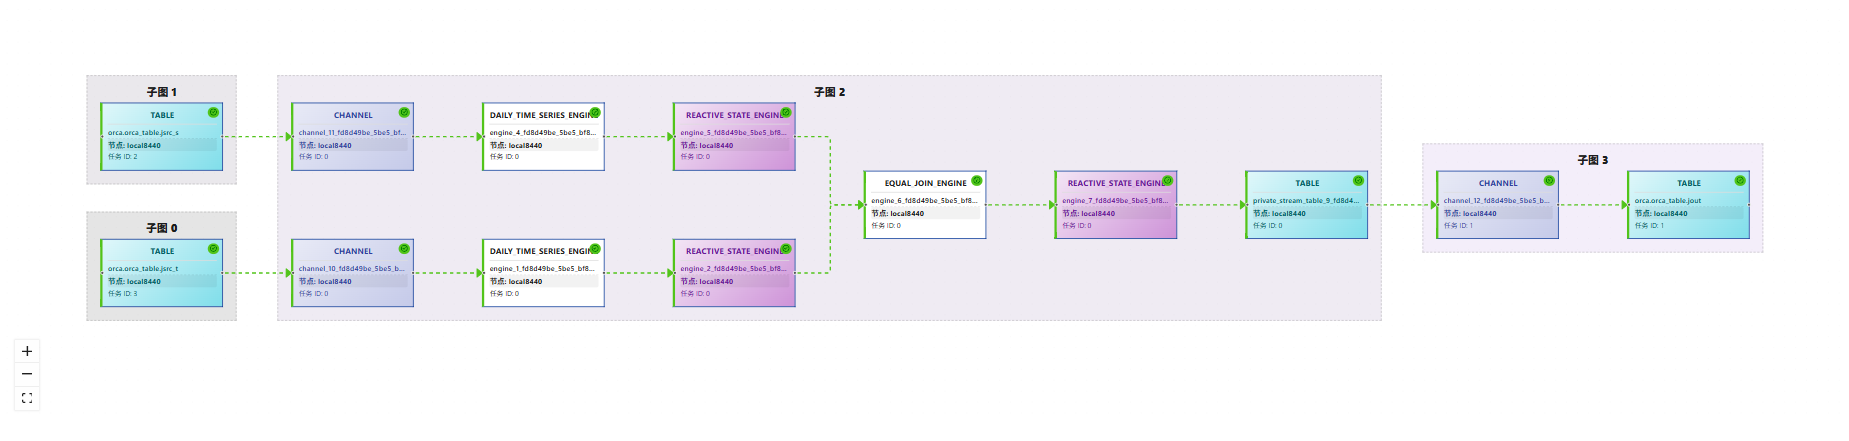
Take the "downsampling + derived factor generation" as an example: trade and snapshot data arrive as two separate raw streams. Each goes through a time-series engine and a reactive state engine to produce minute-level indicators. After that, the two streams need to be aligned and merged by security ID and timestamp before a combined derived factor — one that draws on both sides — can be computed. Here's the corresponding ORCA script:
graphName = "snapTradeFrame"
g = createStreamGraph(graphName)
tradePipeline = (g.source(tradeStreamName, colNames1, colTypes1)
            .dailyTimeSeriesEngine(...)
            .reactiveStateEngine(...)
            .sink(factorDbname+"/"+tradeMinStreamTbname))

snapPipeline = (g.source(snapStreamName, colNames2, colTypes2)
            .dailyTimeSeriesEngine(...)
            .reactiveStateEngine(...)
            )

snapPipeline.equalJoinEngine(
                rightStream = tradePipeline,
                metrics = sqlCol(colNames[2:]),
                matchingColumn = `securityId,
                timeColumn = `tradeTime,
                maxDelayedTime = 1000 * 60 * 60 * 24
            )
            .reactiveStateEngine(
                metrics = facMetrics,
                keyColumn = `securityId,
                parallelism = parallel
            )
            .sink(stringFormat("demo.orca_table.%W", factorTbname))
            .sink(factorDbname+"/"+factorTbname)
g.submit()
After the snapshot and trade streams each produce their own minute-level indicators, equalJoinEngine aligns and merges the two independent pipelines by securityId and tradeTime. The maxDelayedTime parameter caps how long the engine will wait for the other stream — preventing a delay on one side from stalling the entire downstream pipeline indefinitely.
Once merged, the resulting factors are pushed downstream for real-time model inference, generating trading signals, constructing orders, and feeding them into a simulated matching engine that outputs execution details.
 Full pipeline
The pipeline is more complex here, but the core pattern hasn't changed.
Why This Matters
For data-intensive scenarios like real-time market data processing and quantitative trading, the real challenge was never just "getting the pipeline written." It's making that pipeline run reliably and predictably in production, over time.
That's the point of ORCA: it takes streaming components that developers would otherwise have to wire together and maintain by hand, and abstracts them into a composable, orchestratable, recoverable business streaming graph — bringing design, deployment, runtime, and operations together into one coherent loop.
With ORCA, business logic maps naturally onto a real-time computation pipeline, while the system handles scheduling, execution, and fault tolerance. The result: developers can build a complete pipeline — from data ingestion to result output — faster, and gain stronger observability and production resilience when facing performance volatility, node failures, or the need to scale the pipeline further.
For genuinely real-time businesses, that capability isn't just a development-efficiency win — it's the foundation for sustained business value.