China Southern Power Grid Cuts Hardware and Ops Costs with DolphinDB for Edge-to-Cloud Transformer Vibration Monitoring
In its main transformer vibration monitoring project, China Southern Power Grid (CSG) needed to run signal processing and feature extraction on resource-constrained edge devices, compute a large number of monitoring metrics in real time at extremely low latency, and analyze equipment health in the cloud. DolphinDB runs reliably on ARM-based industrial computers with limited hardware, supports sampling rates from 8 kHz to 50 kHz, performs signal processing and real-time feature computation at the edge, and enables edge-cloud collaboration, all while keeping hardware and operations costs under control.

From Scheduled Maintenance to Predictive Maintenance
In the power industry, the traditional reactive model of time-based maintenance and post-failure repair can no longer meet the safety and reliability demands of modern power systems. The shift from scheduled maintenance to condition-based maintenance, and then to predictive maintenance, has become an industry consensus. Vibration monitoring plays a critical role in this transition: early-stage faults such as a loose transformer core or rotor imbalance in a steam turbine can often be detected through subtle changes in the vibration spectrum. As a result, vibration signals are widely regarded as one of the most important indicators of power equipment health.
China Southern Power Grid is a state-owned energy enterprise that provides power supply to five provinces and regions (Guangdong, Guangxi, Yunnan, Guizhou and Hainan) as well as Hong Kong and Macao. Its service area covers 1 million square kilometers and a population of 274 million. In recent years, CSG has made digitalization and intelligence a core strategic priority, advancing the integration of AI and energy systems and driving the transformation toward a new-type power system with digital technology.
In CSG's main transformer SCADA (vibration data acquisition and monitoring) project, the system must:
- perform signal processing and feature computation on resource-constrained edge devices;
- compute a large number of monitoring metrics in real time at extremely low latency; and
- periodically upload data to the cloud, where equipment health can be monitored and analyzed.
Three Edge Challenges: Deployment, Throughput and Computation
The conventional approach to substation vibration monitoring uses C++ or Python programs with file-based storage at the edge, then uploads all raw data to a central platform for centralized analysis. In CSG's main transformer scenario, this approach faces three challenges:
- Lightweight edge deployment is hard to achieve. CSG wanted to embed vibration monitoring and fault diagnosis directly into ARM-based industrial computers. But the hardware on site is limited, and conventional computing frameworks come with large installation packages and many components, making them unsuitable for edge environments.
- High-frequency vibration data creates heavy ingestion pressure. Vibration sensors can sample at up to 50 kHz, so a single device generates tens of thousands of waveform records per second. Conventional solutions struggle to ingest such a data stream reliably at the edge.
- Complex signal processing is difficult to complete in real time. Vibration fault diagnosis relies on compute-intensive algorithms such as FFT spectrum analysis, envelope demodulation and wavelet transforms, and end-to-end alerting requires millisecond-level latency. Conventional architectures schedule compute resources coarsely and cannot deliver high-performance, complex computation on resource-constrained edge devices.
To address these challenges, CSG chose to rethink the problem at the data infrastructure layer, adopting a unified edge-cloud platform to handle the entire pipeline of acquisition, computation and storage.
The DolphinDB Solution: One Foundation, Edge-Cloud Collaboration
After a rigorous evaluation, CSG selected DolphinDB as the data foundation of its vibration monitoring system. The solution combines a real-time analytics engine at the edge with a data storage backbone in the cloud.
At the edge, a standalone DolphinDB node is deployed on the industrial computer in each substation and is responsible for:
- TCP data ingestion and parsing: connecting to the acquisition board through the TCPSocket plugin, with built-in parsing of incoming data
- Raw frame ingestion into stream tables: stream tables cache recent waveform data and serve as the in-memory computing layer
- Anomaly detection: vectorized processing for mean removal, windowing, FFT, and time-domain and frequency-domain feature computation
- Selective waveform retention: preserving the original waveform for anomalies, and storing downsampled data for normal waveforms
- Alert synchronization: pushing alerts to the central site
In the cloud (central site), a DolphinDB cluster or analytics platform is responsible for:
- aggregating feature data from multiple substations;
- displaying alerts and events;
- replaying anomalous waveforms and supporting root-cause analysis; and
- performing long-term trend analysis.
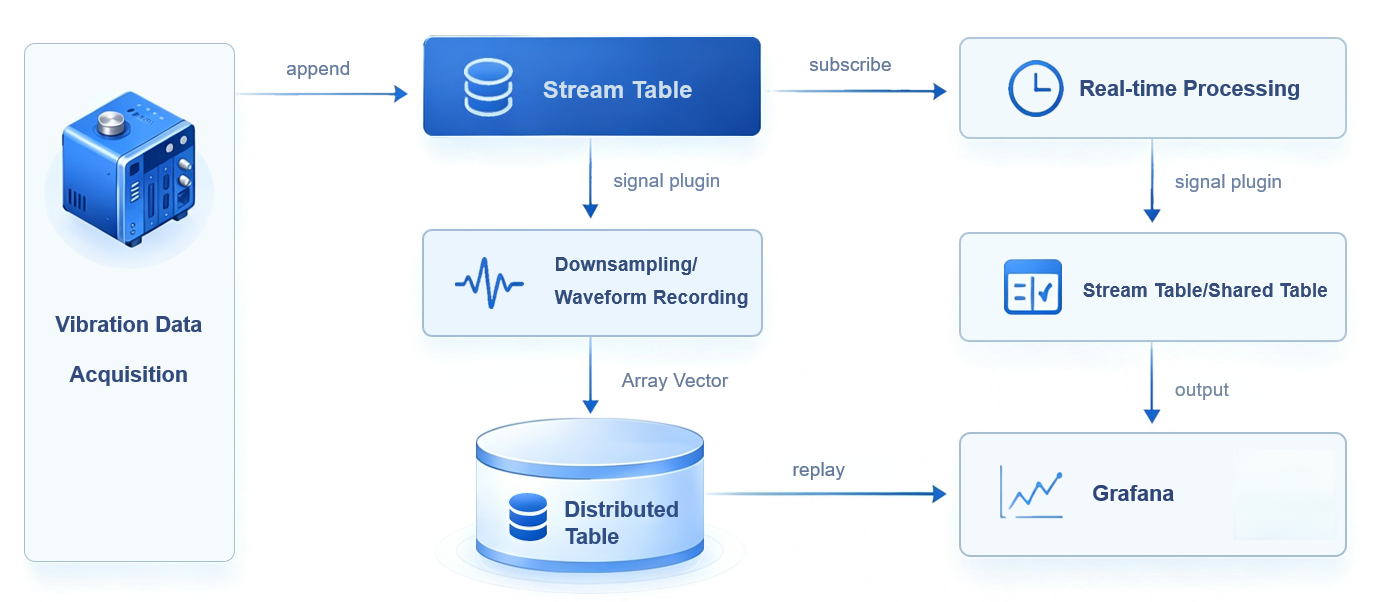
The key advantages of this architecture are:
- Unified, single-process deployment. On resource-constrained industrial computers, every additional program reduces the resources available for computation. DolphinDB consolidates protocol parsing, time-domain transformation, filtering and anomaly detection into a single process, so the full lifecycle of vibration data is handled within one product. This eliminates inter-process communication and component integration overhead, enables lightweight edge deployment, and lowers maintenance costs.
- Low resource footprint. DolphinDB reduces computational overhead through incremental computation and vectorized processing. By consolidating ingestion, computation, decision logic and distribution into one processing chain, it avoids the thread switching, redundant data copying and memory consumption that come with multiple processes and middleware components. This "fewer components, shorter pipeline, less redundant computation" design keeps CPU, memory and storage usage under control and ensures stable real-time processing of high-frequency data streams.
- High-performance complex computation. DolphinDB's built-in signal plugin provides waveform computation and Fourier transform capabilities out of the box. Signal processing logic that would normally take hundreds of lines of code can be written in just a few lines of script. Compute-intensive tasks run locally at the edge and, combined with vectorized programming, bring diagnostic latency down from seconds to milliseconds, enabling complex real-time computation on vibration data.
With powerful built-in signal processing functions, real-time stream processing and a lightweight edge footprint, DolphinDB makes it possible to run the full vibration acquisition pipeline on standard industrial computers. A system that would otherwise demand a faster CPU, more memory and greater bandwidth now runs stably on commodity hardware, providing an effective path to cost control.
Key Implementation
The following code shows a real-time processing pipeline from vibration data ingestion to anomaly alerting. The core steps are downsampling and storage, feature computation, and anomaly detection with waveform capture. All of it runs as data streams in, with no offline batch processing required.
Downsampling with a time-series engine
// Create a time-series engine that keeps the last raw record every 5 minutes to downsample the original data
metricsDownSampling = parseExpr(each(add,'last(',(`d+string(0..255)+")")))
downsampling = createTimeSeriesEngine(name="downsampling",  windowSize=5*60*1000, step=5*60*1000, metrics=metricsDownSampling, dummyTable=wave, outputTable=wave5M, timeColumn=`datetime, keyColumn=`source)
subscribeTable(tableName='wave',actionName="down_sampling", offset=0, handler=append!{downsampling}, msgAsTable=true)
subscribeTable(tableName='wave5M',actionName='save5mToDFS',offset=0,handler=append!{loadTable("dfs://waveDB5M",'waveDB5M')},msgAsTable=true)
This code creates a time-series engine with a 5-minute window and a 5-minute step. The engine aggregates incoming data by time, returning the last record in each 5-minute window and writing it to the wave5M table. Two subscriptions are also created:
down_samplingsubscribes to thewavestream table and feeds the data into the time-series engine for downsampling.save5mToDFSsubscribes to thewave5Mstream table and persists the downsampled data into a distributed database table.
Computing per-second waveform peaks
// Define the handler function
def metricCal(engineName,msg){
	t = select datetime,source,rowMin(msg[,2:258]) as min,rowMax(msg[,2:258]) as max from msg
	getStreamEngine(engineName).append!(t)
}
// Define the aggregation rules
metrics=<[max(max),min(min)]>
inputSchema = table(100:0, `datetime`source`min`max,[TIMESTAMP,SYMBOL,DOUBLE,DOUBLE])
// Create a time-series engine with a 1-second window and a 1-second step
tsAggr1 = createTimeSeriesEngine(name="tsAggr1", windowSize=1000, step=1000, metrics=metrics, dummyTable=inputSchema, outputTable=stwave, timeColumn=`datetime, keyColumn=`source)
// Subscribe to the wave table to compute the metrics
subscribeTable(tableName="wave", actionName="act_tsAggr1", offset=0, handler=metricCal{"tsAggr1"}, msgAsTable=true);
// Subscribe to the stwave table to persist the peak trend data
subscribeTable(tableName='stwave', actionName='savePeakToDFS', offset=0, handler=append!{loadTable("dfs://waveDB",'waveDB')}, msgAsTable=true)
This code first subscribes to the wave stream table and computes the row-wise minimum and maximum across the measurement points. The results are fed into the time-series engine tsAggr1, which outputs the per-second waveform peaks to the stwave stream table. A second subscription to stwave then persists the peak trend data to the database.
Anomaly detection
// Create an anomaly detection engine with the rules max > 100000 and min < -100000
tsAggr2 = createAnomalyDetectionEngine(name="tsAggr2", metrics=<[max_wave > 100000, min_wave <-100000]>, dummyTable=stwave, outputTable=warn, timeColumn=`datetime, keyColumn=`source, windowSize=60*1000, step=60*1000)
// Subscribe to stwave for anomaly detection
subscribeTable(tableName="stwave", actionName="act_tsAggr2", offset=0, handler=append!{tsAggr2}, msgAsTable=true);
// Subscribe to the warn table to persist anomaly records
subscribeTable(tableName='warn', actionName='saveWarnToDFS', offset=0, handler=append!{loadTable("dfs://warnDB",'warnDB')}, msgAsTable=true)
This code creates an anomaly detection engine that subscribes to the peak stream table stwave. Records that satisfy the rules (max_wave > 100000 or min_wave < -100000) are written to the warn table, and a further subscription persists the anomaly records to the database.
The complete project code is available from DolphinDB.
A New Path to Lower Costs and Higher Efficiency in the Power Industry
In CSG's main transformer vibration monitoring project, DolphinDB addressed the core challenges of computing and storing vibration feature data and enabling edge-cloud collaboration. It delivers millisecond-level real-time monitoring and low-latency fault alerting on standard industrial computers. At the architecture level, a single DolphinDB deployment replaces the combination of a real-time database, a stream processing engine and a signal analysis toolkit, significantly reducing deployment and operations costs.
Vibration monitoring is one of the toughest problems in the power industry: the data is hard to store, expensive to compute and difficult to manage. CSG's experience with DolphinDB demonstrates a viable path forward: instead of piling on hardware to gain performance, unlock the potential of existing hardware through a more consolidated software architecture. As high-frequency acquisition, real-time computation and edge-cloud collaboration come together on the industrial computer, this may well be the future of intelligent operations at scale for a power industry moving steadily toward condition-based and predictive maintenance.